Projects
Wheeler River – Phoenix ISR Project
Phoenix ISR Project

Detailed
Maps
New Maps Coming Soon.

Recent
Photos
New Photos Coming Soon.

Drone
Video
Drone Video
Drone Video Pending.

Featured
Video
Featured Video
Featured Video Pending.
Project Hightlights
In February 2026, Denison made its Final Investment Decision (“FID”) for Phoenix. In late 2025 and early 2026, the Company had received the Permit to Construct a Pollutant Control Facility from the Saskatchewan Ministry of Environment and the Construction License from the Canadian Nuclear Safety Commission, along with receipt of provincial and federal approvals for the Project’s Environmental Assessment. These provincial and federal permits and licenses represent the primary approvals required for commencement of construction of the Project. Phoenix is the first uranium mine in Canada to receive federal approval for construction in over 20 years.
2023 Phoenix FS Highlights
- The Phoenix Feasibility Study (“Phoenix FS”) was completed by Wood Canada Limited (“Wood”), WSP USA Environment and Infrastructure Inc. (“WSP”), SRK Consulting (Canada) Inc. (“SRK”), and Newmans Geotechnique Inc. (“Newmans”) effective June 2023.
- Base case pre-tax Net Present Value (“NPV”) (8%) of $2.34 billion (100% ownership-basis) is a 150% increase in the base-case pre-tax NPV8% for Phoenix from the 2018 PFS.
- Very robust base-case pre-tax Internal Rate of Return (“IRR”) of 105.9%.
- Base-case after-tax NPV8% of $1.56 billion (100% basis) and IRR of 90.0% – with Denison’s effective 95% interest in the project equating to a base-case after-tax NPV8% of $1.48 billion.
- Base-case pre-tax and after-tax payback period of 10 months – equating to a reduction of 11 months for the pre-tax payback period from the 2018 PFS.
- Production profile has been optimized, based on ISR mine planning efforts evaluating production potential for individual well patterns – resulting in an increase to the planned rate of production by approximately 43% during the first five years of operations.
- Estimated pre-production capital costs of under $420 million (100% basis), yielding an impressive after-tax NPV to initial capital cost ratio in excess of 3.7 to 1.
- Robust economics easily absorb cost-inflation and design changes impacting both operating and capital costs, confirming Phoenix’s position with estimated cash operating and all-in costs expected to be amongst the lowest-cost uranium mines in the world.
- Phoenix FS plans are aligned and costed to meet or exceed environmental criteria expected to be required by the ongoing regulatory approval process.
- Updated mineral resource estimate, reflecting results of 70 drill holes completed in support of ISR de-risking and resource delineation activities, has upgraded 30.9 million pounds U3O8 into Measured mineral resources, and increased the average grade of the Zone A high-grade domain, which is now estimated to contain 56.3 million pounds U3O8 in Measured and Indicated mineral resources, at an average grade of 46.0% U3O8.
- Upgraded 3.4 million pounds U3O8 into Proven mineral reserves, representing the equivalent of 85% of production planned during the first calendar year of operations.
2026 Phoenix Initial Capital Cost Update
Based on the substantial completion of project engineering and execution of significant procurement activities since the effective date of the Phoenix FS, an updated initial capital cost estimate for the Project was released by the Company in January 2026. Accounting for increases in inflation, cost increases, and project refinements, the Company now estimates the total post-FID initial capital estimate for the Project to be approximately $600 million.
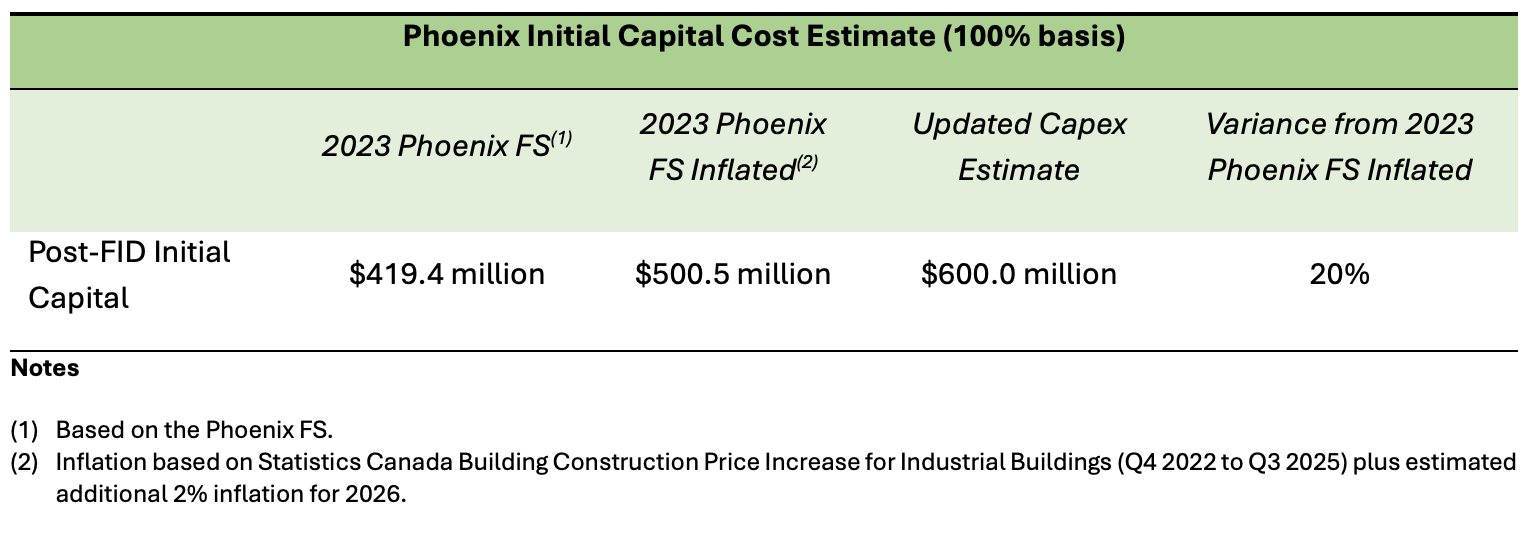
The 2026 Capex Update includes $65 million in contingency funds and owners’ reserves, which represents approximately 12.5% of direct and indirect Project costs and excludes approximately $100 million in pre-FID expenditures, which compares to $67.4 million in pre-FID expenditures estimated in the Phoenix FS.
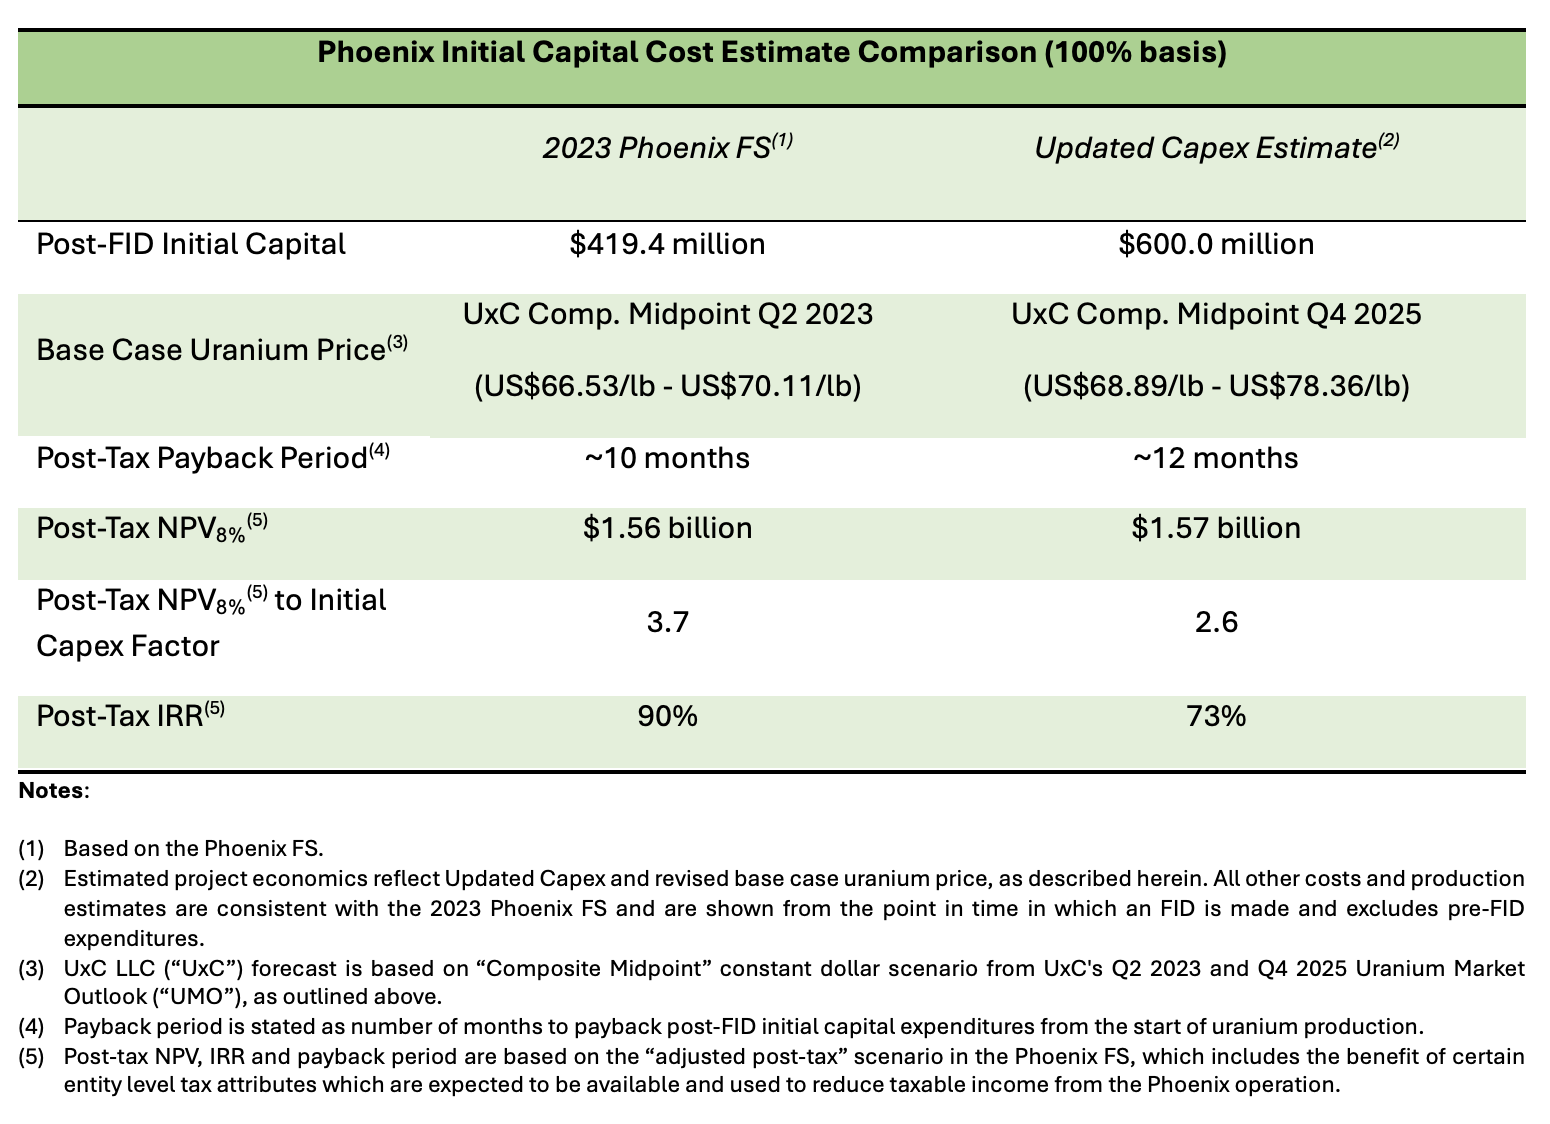
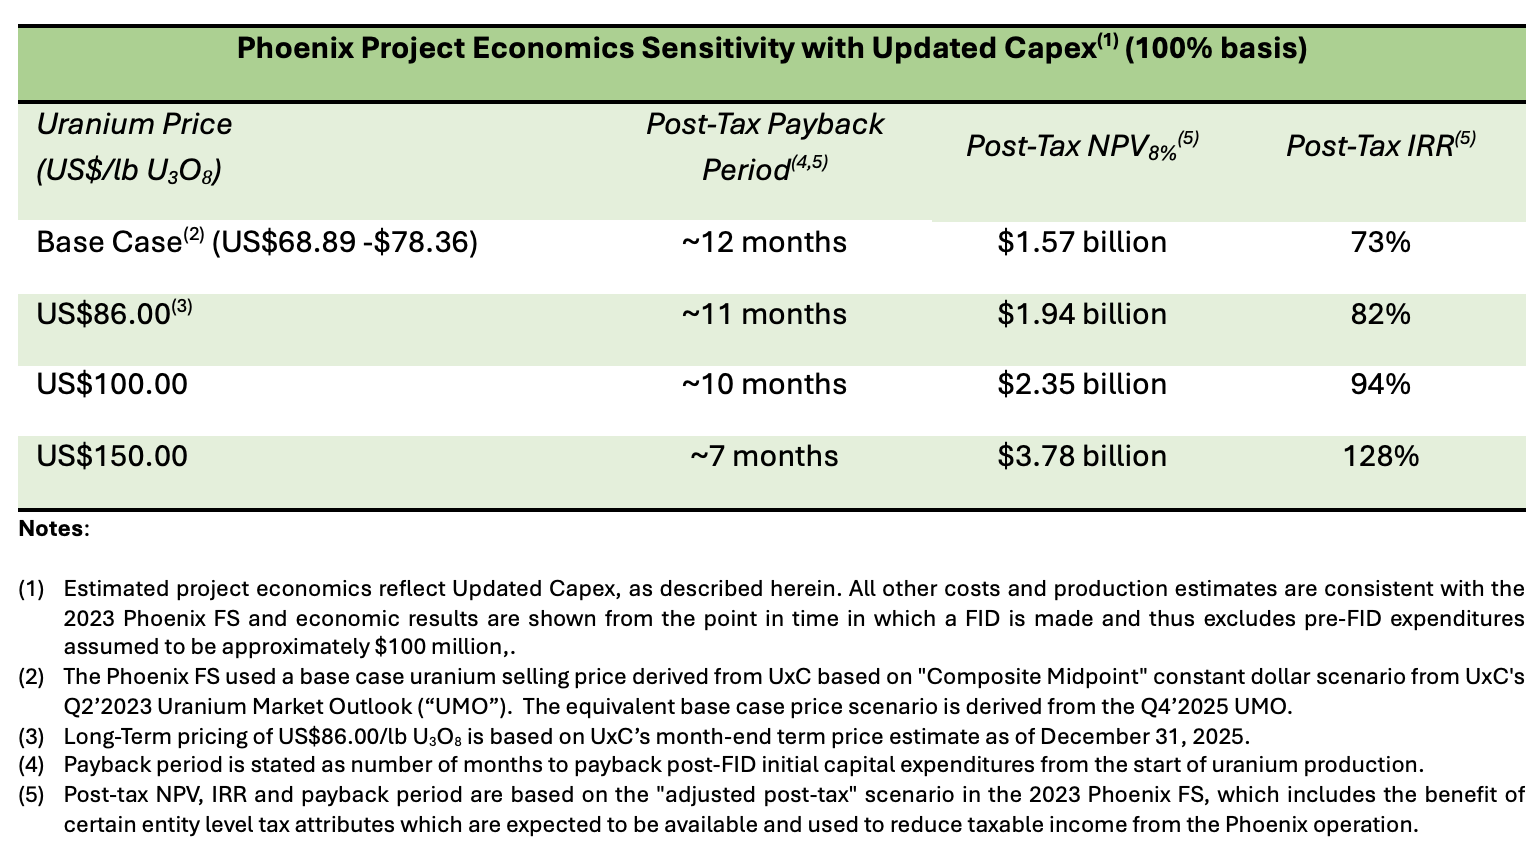
Based on the Updated Capex, the Project’s sensitivity to the uranium price has been updated. Since the Phoenix FS, expected uranium spot prices have increased slightly, whereas long-term uranium prices, which are intended to represent the pricing for base-escalated long-term contracts in today’s dollars, have increased over 50% to US$86.00 per pound U3O8 compared to US$56.00 per pound U3O8 at the time of announcing the Phoenix FS.
All amounts are stated in Canadian dollars unless otherwise noted and computed using the same foreign exchange rate assumptions as used in the Phoenix FS (i.e. a US dollar to Canadian dollar exchange rate of 1.35).
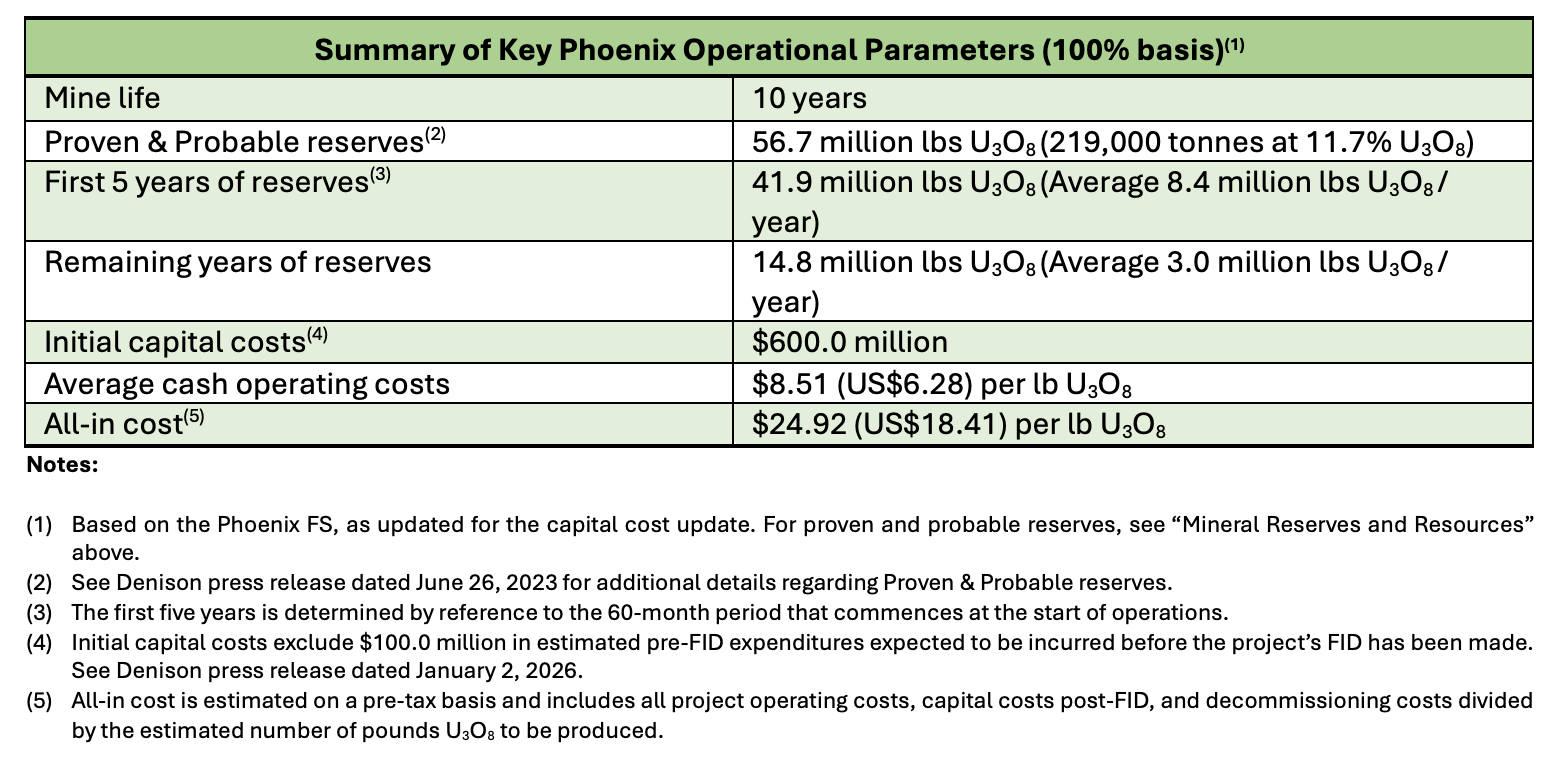
This Wheeler River project description (including the technical details underlying the 2026 Capex Update) is supported by the Wheeler Report. There are no material changes to the technical information used for the Phoenix FS as described in the Wheeler Report, and Denison continues to expect the estimated construction timeline, annual rates of uranium production, operating costs, sustaining capital costs and reclamation costs to be largely consistent with the Phoenix FS. Accordingly, Denison is not, at this time, providing any updates to the Phoenix operating cost or other estimates in the Wheeler Report; however, it may do so in the future.
The Wheeler Report is recommended to be read in its entirety for a more fulsome understanding of the technical aspects of the Wheeler River project.
Phoenix FS – Mineral Resource and Mineral Reserve Estimates
Mineral Resource Estimate
The Phoenix mineral resource estimate has been updated to reflect 70 additional drill holes completed since the previous mineral resource estimate from 2018. The additional drilling consisted primarily of test wells installed to support ISR de-risking activities and certain targeted resource definition drill holes. As a result of the additional drilling, 30.9 million pounds U3O8 have been upgraded from Indicated mineral resources to Measured mineral resources in recognition of the increased confidence in certain areas of Phoenix Zone A.
The updated Phoenix mineral resource estimate, inclusive of mineral reserves, is summarized below. Mineral resources that are not mineral reserves do not have demonstrated economic viability at this time.
|
Table 3 – Estimated Phoenix Mineral Resources (100% Basis) |
||||||
|---|---|---|---|---|---|---|
|
Confidence Category |
Domain |
Volume |
Density |
Tonnes |
Average |
Contained |
|
Measured |
ZoneA_HG |
6,729 |
3.84 |
25.9 |
50.7 |
28.9 |
|
ZoneA_LG |
16,459 |
2.33 |
38.3 |
2.3 |
2.0 |
|
|
Total |
23,187 |
2.77 |
64.2 |
21.8 |
30.9 |
|
|
Indicated |
ZoneA_HG |
8,773 |
3.37 |
29.6 |
42 |
27.4 |
|
ZoneA_LG |
57,858 |
2.33 |
134.8 |
2.0 |
5.8 |
|
|
ZoneB_HG |
4,334 |
2.66 |
11.5 |
22.3 |
5.7 |
|
|
ZoneB_LG |
17,114 |
2.34 |
40.1 |
0.9 |
0.8 |
|
|
Total |
88,079 |
2.45 |
216.0 |
8.3 |
39.7 |
|
|
Total Measured and Indicated |
111,266 |
2.52 |
280,2 |
11.4 |
70.5 |
|
|
Inferred |
ZoneA_Bsmt |
2,401 |
2.34 |
5,6 |
2.6 |
0.3 |
- The effective date of the mineral resource estimate is June 23, 2023. The Qualified Person (QP) for the estimate is Mr. Cliff Revering, P.Eng., an employee of SRK.
- Mineral resource estimates are prepared in accordance with CIM Definition Standards (CIM, 2014) and the CIM Estimation of Mineral Resources and Mineral Reserves Best Practice Guidelines (CIM, 2019).
- Mineral resources are reported at a cut-off grade of 0.1% U3O8
- Mineral resources are reported using a uranium price of USD$55/lb.
- All figures have been rounded to reflect the relative accuracy of the estimate. Figures may not add due to rounding.
Mining Overview & Mineral Reserve Estimate
Phoenix is planned to be the first uranium ISR mining operation in the Athabasca Basin region. Comprehensive field and laboratory test work has been completed to de-risk the use of the ISR mining method at the Phoenix deposit – including the highly successful completion of the leaching and neutralization phases of the FFT at Phoenix in the fall of 2022. Over 3,300 data points have been collected within Phoenix to advance hydrogeological evaluations, and extensive groundwater flow modelling has been completed to develop an advanced three-dimensional estimation of the subsurface flows within and surrounding the Phoenix deposit. The data allowed for modelling of complex hydrogeological and geochemical datasets, which together with the uranium recovery curve, were used to estimate the rate of uranium dissolution within the orebody and facilitate the detailed wellfield design and production planning process.
The uranium recovery curve was obtained empirically from metallurgical testing completed at the Saskatchewan Research Council (“SRC”) facility under the supervision of industry experts. Over 125 kilograms (kg) of Phoenix mineralized samples were leached in a variety of settings, including intact cores under ISR conditions representative of the deposit, and column leaching and remediation tests representative of specific hydrogeological units (‘HGUs’) of the deposit. The results, including those from (i) the FFT (which confirm the early stages of the leaching curve), (ii) core leach test #4 (which was leached over 377 days to over 97% recovery), and (iii) core leach test #5 (which is representative of the HGU estimated to contain the largest mass of uranium in the deposit) were used to inform and validate the uranium recovery curve.
A unique characteristic of the planned Phoenix ISR mine is the use of artificial ground freezing around the perimeter of the planned Phoenix mining phases to create a vertical hydraulic barrier surrounding the ISR mining area. The freeze perimeter is a tertiary containment measure, and is planned to consist of vertical freeze wells constructed from surface and extending into the impermeable lower basement rock underlying the deposit, which are designed to reduce the temperature of and freeze the ground adjacent to the wells to encircle the mining area with up to a 10-metre thickness of frozen ground.
Mining is planned to occur over a 10-year period, spanning 11 calendar years, with partial years of production occurring in both the first and final calendar year of the production plan. Progressive reclamation and decommissioning is planned to commence in each phase of the ore zone once production has ceased.
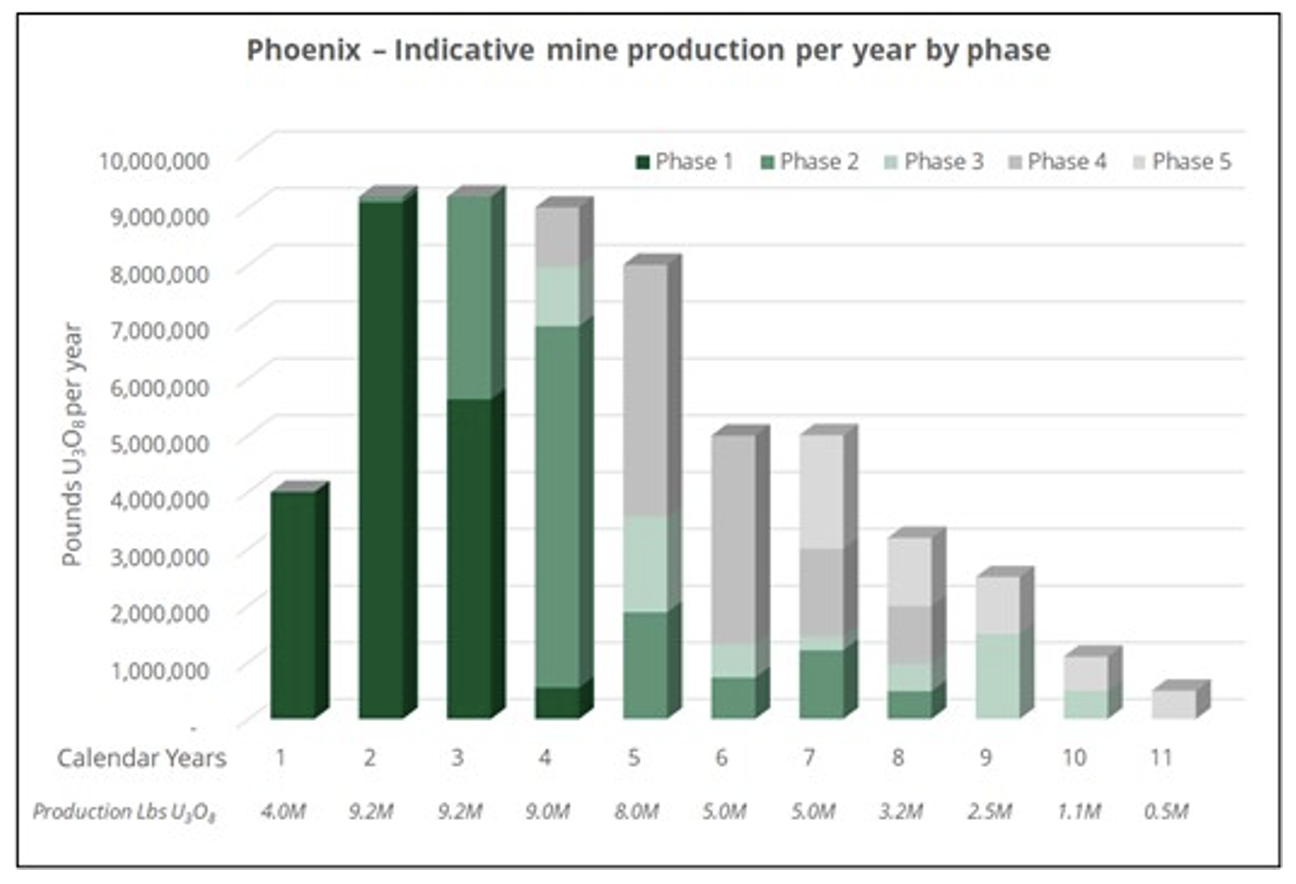
The Proven and Probable mineral reserves are estimated to be 56.7 million pounds U3O8. This estimate is based on the aggregate mine feed to the plant and represents 80.6% recovery of the total available uranium (U3O8 in the measured and indicated mineral resources. Proven mineral reserves are those which were subject to a recovery test during the FFT in 2022.
|
Table 5 – Phoenix Mineral Reserves (100% Basis) |
|||
|---|---|---|---|
|
Mining Phase by Confidence Category |
Tonnes |
Grade |
Recoverable U3O8 |
|
Proven |
|
|
|
|
Phase 1 |
6.3 |
24.5 |
3.4 |
|
Probable |
|
|
|
|
Phase 1 |
41.3 |
20.2 |
18.4 |
|
Phase 2 |
45.2 |
13.8 |
13.7 |
|
Phase 3 |
20.3 |
11.0 |
4.9 |
|
Phase 4 |
68.9 |
7.2 |
10.9 |
|
Phase 5 |
37.0 |
6.6 |
5.4 |
|
Total |
219.0 |
11.7 |
56.7 |
- The effective date of the mineral reserve estimate is June 23, 2023. The QP for the estimate is Mr. Dan Johnson, P.E., an employee of WSP.
- Mineral reserves are estimated at a cut-off grade of 0.5% U3O8 based on the ISR mining method using a long-term uranium price of USD$50/lb U3O8 and a USD$/CAD$ exchange rate of 1.33. The mineral reserves are based on mine operating cost of $0.78/lb U3O8, process operating cost of $5.20/lb U3O8, and process recovery of 99%, as discussed below.
Processing Overview
Consistent with the 2018 PFS, the Phoenix FS calls for the construction of a processing plant on the Wheeler River site, which has been designed to receive uranium bearing solution (“UBS”) from the wellfield for processing to a finished yellowcake product that meets industry standards.
An acidic lixiviant solution is prepared in the processing plant and transferred to an injection solution handling system for distribution in the wellfield. The solution is injected through a series of wells arranged in a pattern surrounding extraction / recovery wells, which are designed to pump the UBS up to surface once the lixiviant has travelled through the ore zone and dissolved the uranium from the host rock.
Once the UBS is received at the processing plant, removal of impurities such as iron (Fe) and radium (Ra) occur via Stage 1 (Fe/Ra) precipitation. Next the purified leach solution feeds the Stage 2 yellowcake precipitation circuit and the yellowcake product is dried and packaged for shipment. The processing plant has been designed based on an average uranium head grade of the UBS recovered from the wellfield of 22 grams per litre and is expected to recover 96.5% of the uranium feed contained in UBS after a 6 month ramp up period of the plant (when recovery is expected to be initially 93.4%). Taken together with planned subsequent recoveries of uranium contained in the Stage 1 (Fe/Ra) precipitation product, total recovered uranium of 56.2 million pounds U3O8 is planned to be available for sale – representing a combined 99% recovery rate.
Overall, the processing plant flowsheet remains largely consistent with the 2018 PFS; however, additional provisions have been included for effluent treatment via a three-stage neutralization process. Whereas the 2018 PFS assumed a “closed loop” processing system, the Phoenix FS design is aligned with the engineering components and criteria included in the Environmental Assessment (“EA”) for the project, which allow for the treatment of process solutions and controlled release of a treated effluent to the environment. This is an example of how the iterative nature of the EA process has informed project designs during the Phoenix FS process, to ensure that the plans are aligned and costed to meet or exceed environmental criteria expected to be required by the ongoing regulatory approval process. While this design for effluent treatment has been adopted for the Phoenix FS, the potential remains for ongoing FEED studies to optimize the processing plant design.
Operating Costs
Average estimated operating costs of $8.51 (USD$6.28) per pound U3O8 produced remain highly competitive amongst the lowest-cost uranium mining operations globally. Operating costs during the first five years of production are expected to be $6.64 (USD$4.90) per pound U3O8, benefitting from increased scale of operations and higher concentrations of uranium contained in recovered UBS. During the remaining years of production, operating costs are expected to be $13.69 (USD$10.10) per pound U3O8.
|
Table 7 – Phoenix Operating Cost per Pound U3O8 |
||
|---|---|---|
|
|
CAD$ |
USD$ |
|
Mining / Wellfield |
0.79 |
0.58 |
|
Processing |
5.25 |
3.88 |
|
Transport to converter |
0.24 |
0.18 |
|
Site support and administration |
2.23 |
1.64 |
|
Total Operating Costs per pound U3O8 |
$8.51 |
$6.28 |
- Numbers may not add due to rounding.
Uranium Selling Price Assumptions
The base-case economic analysis assumes uranium sales from Phoenix mine production will be made from time to time throughout the production period at the forecasted annual “Composite Midpoint” uranium spot price from the Q2’2023 Uranium Market Outlook (“UMO”) issued by UxC, LLC (“UxC”), which is stated annually in constant (non-inflated) 2023 dollars and ranges from ~USD$66 to USD$70 per pound U3O8 during the indicative production period of the Phoenix operation. This is the same pricing methodology applied for Phoenix as the base-case scenario in the 2018 PFS, where the “Composite Midpoint” uranium prices during the indicative years of production then ranged from only USD$29 to USD$45 per pound U3O8 in constant 2018 dollars. Consistent with the 2018 PFS, the overall cost profile and construction timeline of the planned Phoenix ISR mine is not expected to require substantial contract base loading to justify development. Accordingly, the spot price indicator from UxC has been used for the Phoenix base-case economic analysis.
The PFS reference case economic analysis reflects the outcome of the current Phoenix FS based on a uranium selling price that is the same as the “High Case” previously reported from the 2018 PFS, which was based on a fixed uranium selling price of USD$65 per pound U3O8 and a US to Canadian dollar exchange rate of 1.3 to 1. This case allows for a direct comparison of the NPV outcome from the Phoenix FS to the 2018 PFS.